Bloodwork
Understand bloodwork, not just read it
The lab report says “ferritin 18 ng/ml” and an asterisk. Lumilnar reads the report, puts every value in its reference range, shows the history across all reports – and explains what the value may mean in the context of your supplements, your food and your symptoms.
- Import by photo or PDF, multi-page reports included
- Every marker with unit, reference range and flag
- History per marker across all reports
- AI analysis with your stack, food and symptoms as context
- Bloodwork feeds supplement deep dives and symptom analyses

How your lab report gets into the app
- 1
Photograph the report or pick the PDF
One photo per page, or the PDF from the lab portal. Lumilnar recognises layout, tables and units – including decimal commas and unusual formats.
- 2
Values are extracted
Processing runs in the background, page by page. Every marker gets value, unit, reference range and flag; values without a reference are marked as such.
- 3
Check the report
You see all markers in the overview, abnormal ones on top. One tap opens the marker’s history across all previous reports.
- 4
Read the analysis
The AI analysis explains the abnormal values, links them with your supplements, food and symptoms and names questions for the next doctor’s appointment.
- 5
Continue in the chat
Ask: what the value means, what could influence it, which nutrients relate to it. The coach knows the whole report.

Import that understands lab formats
Lab reports look different everywhere: tables, columns, commas instead of points, reference ranges as “< 5” or “10 – 20”. Processing is built for that, reads multi-page reports in parallel and merges them into one report. Values with zero or an implausible unit are flagged instead of silently accepted.
History per marker
A single value says little. Lumilnar keeps every marker across all reports – ferritin from 2024 to today, vitamin D before and after supplementation – and shows whether anything moves. The reference range is stored per report because labs use different ranges.

Analysis with your context
The analysis gets not only the numbers but also what you take, how you eat, what you lack and what you track. Low ferritin reads differently when iron is in the stack and tiredness is in the symptom diary. The result: an assessment in plain language, possible connections, concrete questions for the practice – without a diagnosis.

Bloodwork wherever it helps
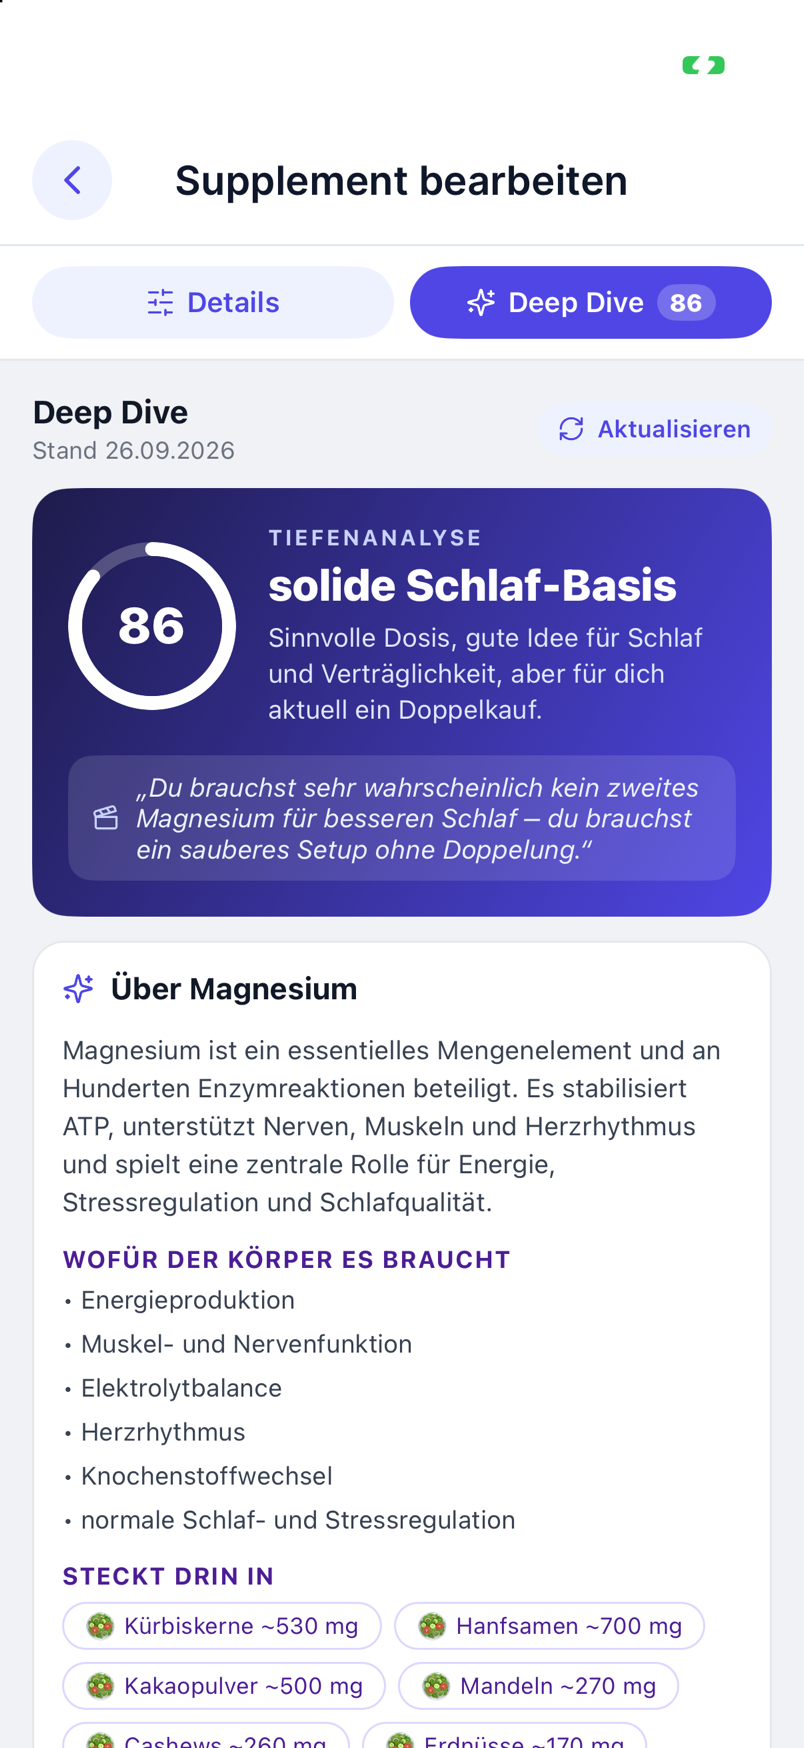
The supplement deep dive checks a product’s fit against your values (“selenium 68 µg/l ↓ low”). The symptom analysis uses lab values as context. The coach in the app and in Claude or ChatGPT cites values with dates instead of guessing.
Frequently asked questions
Which reports can Lumilnar read?
Photos and PDFs of lab reports in German or English, single or multi-page. Handwritten values can be entered manually.
Are reference ranges taken from the lab?
Yes, per report. If a range is missing, the value is stored without a flag and still kept in the history.
Does the analysis make diagnoses?
No. It explains values and connections in your data and formulates questions for medical clarification. Treatment decisions belong in the practice.
Where are the reports stored?
In your database in the EU; images are stored encrypted. You can delete reports at any time.
Lumilnar is on the App Store – free during the open beta.
Get it on the App Store